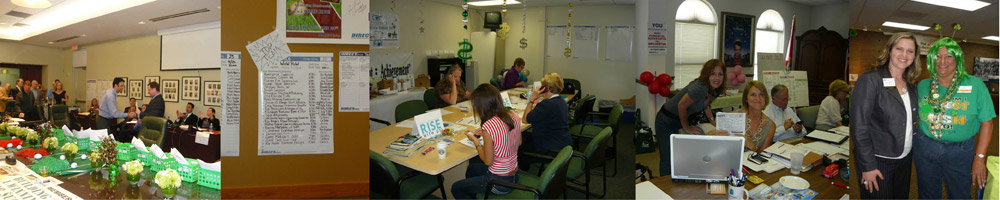
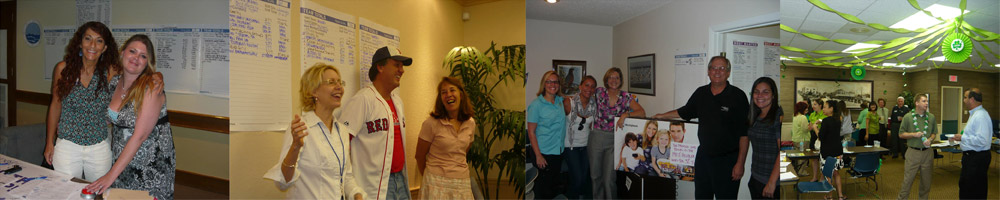
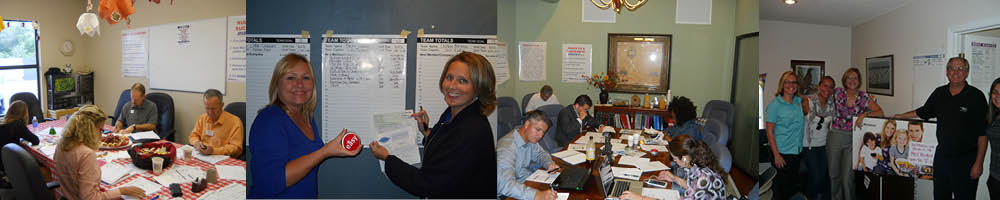
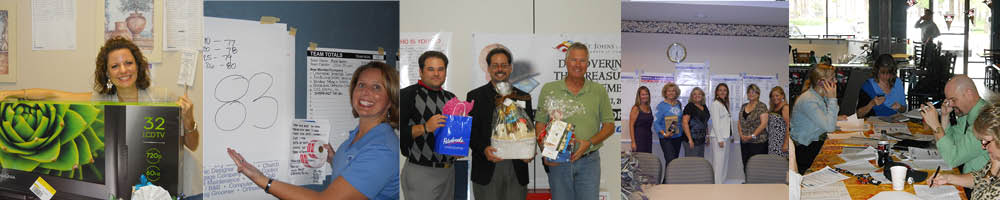
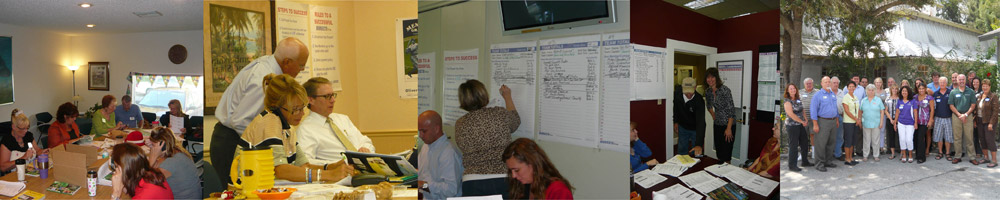
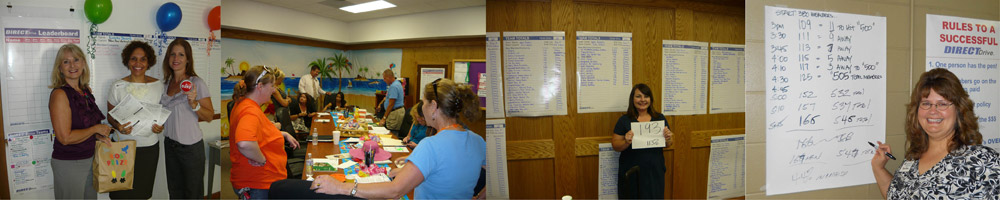
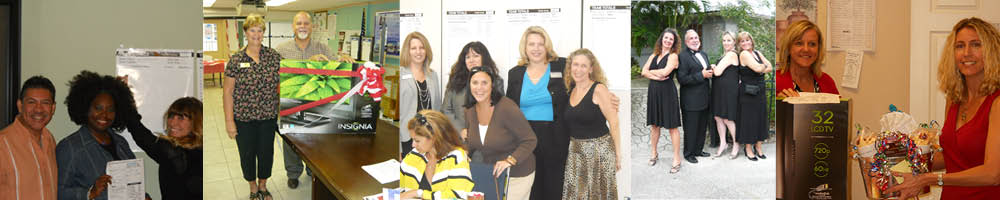
“Thank you for the Chamber Membership Drive Training with Oliver Group DIRECT. What I saw unfold as Rob and Kate Oliver worked their magic on the room was one of the finest deliveries of fun, learning and practical marketing tools that I have seen from any platform anywhere in the
Home of the Oliver Group DIRECT LLC
Oliver Group DIRECTDrive
The Place for Member Driven Associations that are Ready to Boost Membership FAST!
The Place for Member Driven Associations that are Ready to Boost Membership FAST!
Partial Client List
Recent Comments
-
Michael Sipe, President, CrossPoint Capital
-
Anne Hotte, Hollywood Chamber of Commerce
Rob & Kate, No way! These flowers are just beautiful! Is this another example of “shock and awe”? It works! We are sharing the timeline and new approach to retention at the staff meeting tomorrow! I am so excited about it! Thank you for ALL that you did! You make
-
Maria Patterson, Carrollwood Area Business Association
Dear Rob & Kate, Thank you many times over for facilitating the most successful Membership Drive in the history of CABA! We appreciate all you have taught us and all the expert information and advice you have generously shared. You are both a joy to work with and thank you
-
Patricia Crowley, Greater Hernando County Chamber of Commerce
Dear Rob and Kate, On behalf of the Greater Hernando County Chamber of Commerce Board of Directors, thank you for presenting your “DIRECTDrive” to our membership committee. The teachings you shared certainly were a result of our successful Membership Drive. We appreciate your support to the Chamber and look forward
Read All Comments
DIRECTDrive Results Archive
| Year | Alabama Associations | Start Total | Drive Total | Grand Total | % of Growth |
| 2008 | AHB of Greater Birmingham | 2148 | 92 | 2240 | 4.00% |
| Year | Arkansas Associations | Start Total | Drive Total | Grand Total | % of Growth |
| 2009 | NE Arkansas HBA | 94 | 58 | 152 | 62.00% |
| 2009 | Carroll County HBA | 45 | 35 | 80 | 78.00% |
| Year | Arizona Associations | Start Total | Drive Total | Grand Total | % of Growth |
| 2009 | HBA of Central Arizona | 522 | 117 | 639 | 22.00% |
| 2009 | Southern Arizona HBA | 682 | 33 | 715 | 5.00% |
| 2012 | NUCA of Arizona | 83 | 7 | 90 | 8.00% |
| Year | California Associations | Start Total | Drive Total | Grand Total | % of Growth |
| 2008 | BIASC – Antelope Valley Chapter | 122 | 8 | 130 | 7.00% |
| 2008 | BIASC – Baldy View Chapter | 254 | 29 | 283 | 11.00% |
| 2008 | BIASC – Desert Chapter | 195 | 15 | 210 | 8.00% |
| 2008 | BIASC – Greater LA/Ventura | 625 | 40 | 665 | 6.00% |
| 2008 | BIASC – Orange County Chapter | 819 | 44 | 863 | 5.00% |
| 2008 | BIASC – Riverside Chapter | 366 | 39 | 405 | 11.00% |
| 2008 | HBA of Northern CA | 828 | 36 | 864 | 4.00% |
| 2008 | HBA of the Central Coast | 257 | 64 | 321 | 25.00% |
| 2008 | North State BIA | 954 | 60 | 1014 | 6.00% |
| 2007 | BIA of Central California | 335 | 25 | 360 | 7.00% |
| 2007 | BIA of San Diego | 1393 | 78 | 1471 | 6.00% |
| 2007 | BIA of the Delta | 250 | 55 | 305 | 22.00% |
| 2007 | BIASC – Antelope Valley Chapter | 47 | 69 | 116 | 147.00% |
| 2007 | BIASC – Baldy View Chapter | 251 | 40 | 291 | 16.00% |
| 2007 | BIASC – Desert Chapter | 227 | 60 | 287 | 26.00% |
| 2007 | BIASC – Greater LA/Ventura | 355 | 29 | 384 | 8.00% |
| 2007 | BIASC – LA County East Chapter | 74 | 12 | 86 | 16.00% |
| 2007 | BIASC – Orange County Chapter | 823 | 72 | 895 | 9.00% |
| 2007 | BIASC – Riverside Chapter | 345 | 71 | 416 | 21.00% |
| 2007 | HBA of Northern CA | 834 | 77 | 911 | 9.00% |
| 2007 | HBA of the Central Coast | 212 | 68 | 280 | 32.00% |
| 2007 | HBA of Tulare & Kings Counties | 199 | 15 | 214 | 8.00% |
| 2007 | North State BIA | 974 | 81 | 1055 | 8.00% |
| Year | Colorado Associations | Start Total | Drive Total | Grand Total | % of Growth |
| 2006 | HBA of Northern Colorado | 420 | 79 | 499 | 19.00% |
| 2006 | HBA of Northwestern Colorado | 341 | 117 | 458 | 34.00% |
| 2006 | HBA of Teller County | 87 | 47 | 134 | 54.00% |
| 2006 | Housing & BA of Colorado Springs | 644 | 93 | 737 | 14.00% |
| 2006 | Pueblo HBA | 342 | 136 | 478 | 40.00% |
| 2011 | NUCA of Colorado | 45 | 7 | 56 | 16.00% |
| Year | Connecticut Associations | Start Total | Drive Total | Grand Total | % of Growth |
| 2007 | HB & RA of Fairfield County | 479 | 85 | 564 | 18.00% |
| 2007 | HBA of Hartford County Inc | 456 | 118 | 574 | 26.00% |
| 2007 | HBA of New Haven County | 185 | 45 | 230 | 24.00% |
| 2007 | HBA of NW Connecticut | 25 | 7 | 32 | 28.00% |
| Year | Florida Associations | Start Total | Drive Total | Grand Total | % of Growth |
| 2009 | BA of North Central Florida | 535 | 111 | 646 | 21.00% |
| 2009 | HBA of West Florida | 330 | 85 | 415 | 26.00% |
| 2009 | HBA of Metro Orlando | 750 | 79 | 829 | 11.00% |
| 2009 | Tallahassee BA Inc | 350 | 77 | 427 | 22.00% |
| 2009 | HBA of Panama City | 186 | 44 | 230 | 24.00% |
| 2009 | BIA of Okaloosa-Walton Cos | 428 | 23 | 451 | 5.00% |
| 2009 | Collier HBA | 650 | 22 | 672 | 3.00% |
| 2010 | Hernando Builders Association | 180 | 83 | 263 | 46.00% |
| 2010 | Gold Coast Builders Association | 445 | 22 | 467 | 5.00% |
| 2010 | Volusia BIA | 275 | 54 | 334 | 20.00% |
| 2010 | Flagler Co – Palm Coast HBA | 165 | 42 | 207 | 25.00% |
| 2010 | Marion County BIA | 250 | 17 | 267 | 7.00% |
| 2010 | HBA of Manatee-Sarasota County | 409 | 66 | 478 | 16.00% |
| 2010 | HB of CA of Brevard | 420 | 34 | 467 | 8.00% |
| 2010 | Treasure Coast BA | 511 | 24 | 532 | 5.00% |
| 2010 | Charlotte-DeSoto BIA | 285 | 58 | 343 | 20.00% |
| 2010 | Northeast Florida BA | 896 | 133 | 1029 | 15.00% |
| 2010 | Charlotte Co. Chamber of Commerce | 1080 | 159 | 1239 | 15.00% |
| 2011 | Greater Sarasota Chamber of Commerce | 1400 | 151 | 1551 | 11.00% |
| 2011 | Clay County Chamber of Commerce | 800 | 77 | 877 | 10.00% |
| 2011 | Melbourne Regional Chamber of Commerce | 1100 | 58 | 1158 | 5.00% |
| 2011 | Greater Fort Myers Chamber of Commerce | 1000 | 88 | 1088 | 8.00% |
| 2011 | Gulf Breeze Area Chamber of Commerce | 400 | 84 | 484 | 21.00% |
| 2011 | Haines City NE Polk County Chamber of Commerce | 300 | 68 | 368 | 23.00% |
| 2011 | Hardee County Chamber of Commerce | 170 | 193 | 363 | 113.00% |
| 2011 | Charlotte County Chamber of Commerce | 1170 | 129 | 1299 | 10.00% |
| 2011 | Perdido Key Area Chamber of Commerce | 312 | 85 | 397 | 27.00% |
| 2011 | Citrus County Chamber of Commerce | 975 | 76 | 1051 | 8.00% |
| 2011 | Christian Chamber of SW Florida | 125 | 56 | 181 | 45.00% |
| 2012 | Greater Riverview Chamber of Commerce | 380 | 167 | 547 | 44.00% |
| 2012 | Walton Area Chamber of Commerce | 780 | 46 | 826 | 6.00% |
| 2012 | Ormond Beach Chamber of Commerce | 650 | 39 | 689 | 6.00% |
| 2012 | Fort Walton Beach Chamber of Commerce | 1200 | 45 | 1245 | 4.00% |
| 2012 | Clay County Chamber of Commerce | 750 | 41 | 791 | 5.00% |
| 2012 | St Johns County CHamber of Commerce | 754 | 54 | 808 | 7.00% |
| 2012 | North Fort Myers Chamber of Commerce | 218 | 40 | 258 | 18.00% |
| 2012 | NUCA of North Florida | 73 | 19 | 92 | 26.00% |
| 2012 | Christian Chamber of Southwest Florida | 175 | 62 | 237 | 35.00% |
| 2012 | Carrollwood Area Business Association | 275 | 85 | 360 | 31.00% |
| Year | Georgia Associations | Start Total | Drive Total | Grand Total | % of Growth |
| 2007 | Greater Atlanta HBA | 3960 | 82 | 4042 | 2.00% |
| 2009 | HBA of Greater Savannah | 486 | 157 | 643 | 32.00% |
| 2009 | HBA of South GA | 270 | 72 | 342 | 27.00% |
| 2009 | Lake Oconee Area BA | 188 | 66 | 254 | 35.00% |
| 2009 | Westside HBA | 292 | 50 | 321 | 47.00% |
| 2009 | Greater Atlanta HBA | 1600 | 30 | 1630 | 2.00% |
| 2009 | HBA of Midwest GA | 106 | 29 | 156 | 10.00% |
| 2009 | HBA of Middle GA (Macon) | 190 | 27 | 217 | 14.00% |
| 2009 | Paulding Co BA | 114 | 16 | 130 | 14.00% |
| 2009 | Newton Co HBA | 115 | 14 | 129 | 12.00% |
| 2009 | HBA of Gainsville-Hall Co | 150 | 12 | 162 | 8.00% |
| Year | Idaho Associations | Start Total | Drive Total | Grand Total | % of Growth |
| 2008 | BCA of SW Idaho | 629 | 101 | 730 | 16.00% |
| 2008 | Snake River Valley CA | 206 | 86 | 292 | 42.00% |
| 2009 | Panhandle BCA | 51 | 44 | 95 | 86.00% |
| 2009 | North Idaho BCA | 279 | 54 | 333 | 19.00% |
| 2009 | Eastern Idaho HBA | 142 | 17 | 159 | 12.00% |
| Year | Illinois Associations | Start Total | Drive Total | Grand Total | % of Growth |
| 2008 | Springfield Area HBA | 264 | 24 | 289 | 9.00% |
| 2007 | Springfield Area HBA | 226 | 49 | 275 | 22.00% |
| 2006 | HBA of East Central IL | 143 | 67 | 210 | 47.00% |
| 2006 | HBA of Greater Fox Valley | 248 | 46 | 294 | 19.00% |
| 2006 | HBA of Greater Peoria | 229 | 193 | 422 | 84.00% |
| 2006 | HBA of Greater Southwest Illinois | 259 | 99 | 358 | 38.00% |
| 2006 | HBA of Southern Illinois | 37 | 25 | 62 | 68.00% |
| 2006 | Metro Decatur HBA | 67 | 60 | 127 | 90.00% |
| 2006 | Northern Illinois HBA Inc | 339 | 57 | 396 | 17.00% |
| 2006 | Southwest Suburban HBA | 473 | 126 | 599 | 27.00% |
| 2006 | Springfield Area HBA | 172 | 52 | 224 | 30.00% |
| 2006 | Will-Grundy Cos HB & Assoc | 250 | 43 | 293 | 17.00% |
| Year | Indiana Associations | Start Total | Drive Total | Grand Total | % of Growth |
| 2007 | BA of Elkhart County | 362 | 64 | 426 | 18% |
| 2007 | BA of Greater Indianapolis | 1158 | 122 | 1280 | 11% |
| 2007 | BA of Greater Lafayette | 210 | 103 | 313 | 49% |
| 2007 | BA of Kosciusko-Fulton Counties | 169 | 100 | 269 | 59% |
| 2007 | BA of Northeast IN | 102 | 57 | 159 | 56% |
| 2007 | BIA of NW Indiana | 380 | 108 | 488 | 28% |
| 2007 | Dearborn County HBA | 73 | 50 | 123 | 68% |
| 2007 | HBA of Fort Wayne | 445 | 150 | 595 | 34% |
| 2007 | HBA of Greater Terre Haute, Inc | 263 | 151 | 414 | 57% |
| 2007 | HBA of Howard County | 144 | 31 | 175 | 22% |
| 2007 | HBA of Southern Indiana | 400 | 146 | 546 | 37% |
| 2007 | HBA of St Joseph Valley | 274 | 87 | 361 | 32% |
| 2007 | Henry County BA | 12 | 13 | 25 | 108% |
| 2007 | Madison County HBA | 47 | 4 | 51 | 9% |
| 2007 | Marshall County BA | 56 | 8 | 64 | 14% |
| 2007 | Muncie HBA | 116 | 10 | 126 | 9% |
| 2007 | Southwestern Indiana BA | 378 | 143 | 521 | 38% |
| 2007 | Vincennes Area BA Inc | 45 | 50 | 95 | 111% |
| Year | Iowa Associations | Start Total | Drive Total | Grand Total | % of Growth |
| 2009 | HBA of Greater Des Moines | 539 | 52 | 591 | 10.00% |
| Year | Kentucky Associations | Start Total | Drive Total | Grand Total | % of Growth |
| 2007 | HBA of Louisville | 2359 | 313 | 2672 | 13.00% |
| 2007 | HBA of Northern KY | 1207 | 126 | 1333 | 10.00% |
| 2007 | HBA of Owensboro | 330 | 56 | 386 | 17.00% |
| 2007 | Lincoln Trail HBA | 450 | 66 | 516 | 15.00% |
| 2007 | Scott County HBA | 139 | 40 | 179 | 29.00% |
| Year | Louisiana Associations | Start Total | Drive Total | Grand Total | % of Growth |
| 2009 | St Tammany HBA | 765 | 37 | 802 | 5.00% |
| 2009 | Acadian HBA | 725 | 35 | 760 | 5.00% |
| 2009 | Northwest Louisiana HBA | 534 | 34 | 568 | 6.00% |
| Year | Maine Associations | Start Total | Drive Total | Grand Total | % of Growth |
| 2009 | Southern York Co HBA | 35 | 32 | 67 | 91.00% |
| 2009 | Southern Maine HB&RA | 86 | 11 | 97 | 13.00% |
| 2009 | Modular HBA of Maine | 60 | 10 | 70 | 17.00% |
| Year | Massachusetts Associations | Start Total | Drive Total | Grand Total | % of Growth |
| 2007 | BA of Central Massachusetts Inc | 306 | 36 | 342 | 12.00% |
| 2007 | BA of Greater Boston | 676 | 104 | 780 | 15.00% |
| 2007 | Bristol-Norfolk HBA | 117 | 28 | 145 | 24.00% |
| 2007 | HBA of Western Massachusetts | 550 | 148 | 698 | 27.00% |
| 2007 | HB & RA of Cape Cod | 155 | 80 | 235 | 52.00% |
| 2007 | NE BA of Massachusetts | 297 | 149 | 446 | 50.00% |
| 2006 | BA of Central Massachusetts Inc | 219 | 102 | 321 | 47.00% |
| 2006 | BA of Greater Boston | 633 | 92 | 725 | 15.00% |
| 2006 | Bristol-Norfolk HBA | 94 | 30 | 124 | 32.00% |
| 2006 | HBA of Western Mass | 386 | 171 | 557 | 44.00% |
| 2009 | HBA of Western Mass | 480 | 63 | 543 | 13.00% |
| 2009 | HB&RA of Cape Cod | 176 | 21 | 197 | 12.00% |
| 2009 | North East BA | 312 | 18 | 330 | 6.00% |
| Year | Michigan Associations | Start Total | Drive Total | Grand Total | % of Growth |
| 2008 | HBA of Central Michigan | 280 | 54 | 334 | 19.00% |
| 2008 | HBA of Grand Traverse Area | 516 | 55 | 571 | 11.00% |
| 2008 | HBA of Greater Grand Rapids | 1099 | 31 | 1130 | 3.00% |
| 2008 | HBA of Greater Kalamazoo | 571 | 26 | 597 | 5.00% |
| 2008 | HBA of Livingston County | 345 | 25 | 370 | 7.00% |
| 2008 | HBA of Washtenaw County | 659 | 20 | 679 | 3.00% |
| 2008 | Shoreline BA | 222 | 7 | 229 | 3.00% |
| 2008 | Tri-Lakes HBA | 104 | 14 | 118 | 13.00% |
| 2007 | BIA of Southeastern Michigan | 1886 | 53 | 1939 | 3.00% |
| 2007 | Greater Lansing HBA | 491 | 24 | 515 | 5.00% |
| 2007 | HBA of Central Michigan | 280 | 50 | 330 | 18.00% |
| 2007 | HBA of Grand Traverse Area | 516 | 50 | 566 | 10.00% |
| 2007 | HBA of Greater Grand Rapids | 1099 | 93 | 1192 | 8.00% |
| 2007 | HBA of Greater Kalamazoo | 571 | 58 | 629 | 10.00% |
| 2007 | HBA of Jackson, Inc | 240 | 55 | 295 | 23.00% |
| 2007 | HBA of Livingston County | 345 | 46 | 391 | 13.00% |
| 2007 | HBA of Mecosta County | 73 | 10 | 83 | 14.00% |
| 2007 | HBA of Shiawassee County | 54 | 6 | 60 | 11.00% |
| 2007 | HBA of Washtenaw County | 659 | 68 | 727 | 10.00% |
| 2007 | Shoreline BA | 222 | 31 | 253 | 14.00% |
| 2007 | Southwestern Michigan HBA | 128 | 27 | 155 | 21.00% |
| 2007 | Tri-Lakes HBA | 104 | 20 | 124 | 19.00% |
| 2009 | HBA of Grand Traverse Area | 391 | 33 | 424 | 9.00% |
| 2009 | BIA of Southeastern MIchigan | 912 | 31 | 943 | 3.00% |
| 2009 | Battle Creek AHB | 76 | 30 | 106 | 40.00% |
| 2009 | HBA of Central Michigan | 347 | 22 | 369 | 6.00% |
| 2009 | HBA Livingston County | 174 | 10 | 184 | 6.00% |
| 2009 | HBA of Mecosta County | 74 | 4 | 79 | 5.00% |
| Year | Minnesota Associations | Start Total | Drive Total | Grand Total | % of Growth |
| 2007 | Arrowhead BBA | 282 | 29 | 311 | 10.00% |
| 2007 | BA of the Twin Cities | 1718 | 101 | 1819 | 6.00% |
| 2007 | Northern Minnesota BA | 128 | 67 | 195 | 52.00% |
| 2007 | Rochester Area Builders Inc. | 531 | 180 | 711 | 34.00% |
| 2007 | Vikingland BA | 153 | 16 | 169 | 10.00% |
| 2006 | Arrowhead BA | 225 | 51 | 276 | 23.00% |
| 2006 | Mid-Minnesota BA | 276 | 108 | 384 | 39.00% |
| 2006 | Minnesota River BA | 150 | 130 | 280 | 87.00% |
| 2006 | Suburban Northwest BA | 251 | 32 | 283 | 13.00% |
| Year | Missouri Associations | Start Total | Drive Total | Grand Total | % of Growth |
| 2009 | HBA of Greater Kansas City | 815 | 148 | 963 | 18.00% |
| 2009 | HBA of St Louis | 857 | 85 | 942 | 10.00% |
| Year | Mississippi Associations | Start Total | Drive Total | Grand Total | % of Growth |
| 2007 | HB&RA of Northeast Mississippi | 130 | 63 | 193 | 48.00% |
| 2007 | HBA of Jackson | 1064 | 271 | 1335 | 25.00% |
| 2007 | HBA of Mid-Mississippi Chapter | 54 | 14 | 68 | 26.00% |
| 2007 | HBA of North Central Mississippi | 115 | 32 | 147 | 28.00% |
| 2007 | HBA of the Mississippi Coast | 678 | 238 | 916 | 35.00% |
| 2007 | North Mississippi HBA | 424 | 134 | 558 | 32.00% |
| 2007 | Pearl River County HBA | 98 | 46 | 144 | 47.00% |
| 2007 | SE Mississippi HBA | 193 | 53 | 246 | 27.00% |
| Year | Montana Associations | Start Total | Drive Total | Grand Total | % of Growth |
| 2008 | Helena BIA | 250 | 261 | 511 | 104.00% |
| 2009 | SW Montana BIA | 437 | 52 | 489 | 12.00% |
| 2009 | Bitterroot BIA | 118 | 30 | 148 | 25.00% |
| 2009 | Missoula BIA | 290 | 57 | 347 | 20.00% |
| 2009 | Flathead Building Association | 334 | 107 | 441 | 32.00% |
| 2009 | SW Montana BIA | 437 | 52 | 489 | 12.00% |
| Year | Nebraska Associations | Start Total | Drive Total | b | % of Growth |
| 2009 | Columbus HBA | 36 | 60 | 96 | 167.00% |
| 2009 | Central Nebraska HBA | 62 | 5 | 57 | 10.00% |
| 2009 | HBA of Lincoln | 538 | 122 | 660 | 23.00% |
| 2009 | Metro Omaha BA | 426 | 62 | 488 | 15.00% |
| 2009 | HBA of the Norfolk Area | 61 | 99 | 160 | 162.00% |
| Year | Nevada Associations | Start Total | Drive Total | Grand Total | % of Growth |
| 2009 | BA of Northern NV | 738 | 14 | 752 | 2.00% |
| Year | New Hampshire Associations | Start Total | Drive Total | Grand Total | % of Growth |
| 2006 | HBA of Manchester | 143 | 39 | 182 | 27.00% |
| 2006 | HBA of Seacoast Region | 208 | 21 | 229 | 10.00% |
| 2006 | Lakes Region B & RA | 93 | 27 | 120 | 29.00% |
| 2006 | Nashua Area HB & RA | 184 | 85 | 269 | 46.00% |
| 2006 | Southern NH HB & RA | 138 | 33 | 171 | 24.00% |
| 2012 | Seacoast NHBRA | 70 | 7 | 77 | 10.00% |
| 2012 | Concord Area HBRA | 75 | 6 | 81 | 8.00% |
| 2012 | Southern NH HB & RA | 70 | 19 | 89 | 27.00% |
| 2012 | Greater Manchester / Nashua HBRA | 205 | 51 | 256 | 25.00% |
| Year | New Jersey Associations | Start Total | Drive Total | Grand Total | % of Growth |
| 2012 | ACCA of New Jersey | 100 | 81 | 181 | 81.00% |
| Year | New Mexico Associations | Start Total | Drive Total | Grand Total | % of Growth |
| 2009 | Santa Fe Area HBA | 670 | 40 | 710 | 6.00% |
| 2009 | BIA of Southern New Mexico | 442 | 30 | 470 | 7.00% |
| Year | New York Associations | Start Total | Drive Total | Grand Total | % of Growth |
| 2007 | B & RA of Northern NY | 99 | 52 | 151 | 53.00% |
| 2007 | Finger Lakes HB & RA | 77 | 77 | 154 | 100.00% |
| 2007 | HBA of Central New York Inc | 254 | 55 | 309 | 22.00% |
| 2007 | Long Island BI | 644 | 69 | 713 | 11.00% |
| 2007 | Niagara County BA | 64 | 24 | 88 | 38.00% |
| 2007 | Queens & Bronx BA | 279 | 33 | 312 | 12.00% |
| 2007 | Rockland County B & R | 134 | 30 | 164 | 22.00% |
| 2007 | Southern Tier HB & RA | 202 | 14 | 216 | 7.00% |
| 2006 | BA of the Hudson Valley | 670 | 56 | 726 | 8.00% |
| 2006 | Buffalo Niagara BA | 220 | 85 | 305 | 39.00% |
| 2006 | B & RA of Northern NY | 66 | 18 | 84 | 27.00% |
| 2006 | Capital Region B & RA | 322 | 23 | 345 | 7.00% |
| 2006 | Finger Lakes HB & RA | 37 | 37 | 74 | 100.00% |
| 2006 | Long Island BI | 623 | 63 | 686 | 10.00% |
| 2006 | New York City BA | 104 | 11 | 115 | 11.00% |
| 2006 | Queens & Bronx BA | 216 | 18 | 234 | 8.00% |
| 2006 | Rochester HBA | 352 | 136 | 488 | 39.00% |
| 2006 | Rockland County B & R | 87 | 45 | 132 | 52.00% |
| 2006 | Southern Tier HB & RA | 141 | 70 | 211 | 50.00% |
| 2009 | Finger Lakes HBRA | 79 | 25 | 104 | 32.00% |
| 2009 | Tompkins/Cortland B&RA | 42 | 5 | 47 | 12.00% |
| Year | North Carolina Associations | Start Total | Drive Total | Grand Total | % of Growth |
| 2009 | HBA of Fayetteville | 495 | 137 | 632 | 28.00% |
| 2009 | Greensboro HBA | 682 | 100 | 782 | 14.00% |
| 2009 | HBA of Hendersonville | 295 | 52 | 347 | 18.00% |
| 2009 | HBA of Asheboro-Randolph | 92 | 50 | 142 | 54.00% |
| 2009 | Asheville HBA | 671 | 48 | 719 | 7.00% |
| 2009 | Wilkes Co HBA | 90 | 45 | 135 | 50.00% |
| 2009 | HBA of Durham, Ornage & Chatham | 718 | 44 | 762 | 6.00% |
| 2009 | HBA of Winston-Salem | 492 | 44 | 536 | 18.00% |
| 2009 | Alamance-Caswell HBA | 285 | 38 | 323 | 13.00% |
| 2009 | Lake Norman HBA | 555 | 29 | 584 | 5.00% |
| 2009 | HBA Wayne Co | 144 | 18 | 162 | 13.00% |
| 2009 | HBA of Raleigh/Wake County | 2900 | 17 | 2917 | 0.00% |
| 2009 | Willmington/Cape Fear HBA | 925 | 17 | 942 | 2.00% |
| 2010 | Gaston County BA | 133 | 12 | 145 | 9.00% |
| 2010 | Hickory & Catawba Valley HBA | 283 | 49 | 332 | 17.00% |
| 2007 | North Dakota Associations | Start Total | Drive Total | Grand Total | % of Growth |
| 2007 | Bismarck-Mandan HBA | 324 | 225 | 549 | 69.00% |
| 2007 | Dickinson Area HBA | 107 | 61 | 168 | 57.00% |
| 2007 | Forx BA | 319 | 92 | 411 | 29.00% |
| 2007 | HBA of Fargo-Moorhead | 845 | 80 | 926 | 10.00% |
| 2007 | Minot Association on Builders | 154 | 92 | 246 | 60.00% |
| Year | Ohio Associations | Start Total | Drive Total | Grand Total | % of Growth |
| 2009 | HBA of Dayton & Miami Valley | 344 | 65 | 409 | 19.00% |
| 2009 | BIA of Central Ohio | 866 | 50 | 916 | 6.00% |
| 2009 | HBA of Greater Cincinnati | 1000 | 41 | 1041 | 4.00% |
| 2010 | HBA of Portage & Summit Counties | 484 | 61 | 545 | 13.00% |
| 2010 | BIA of Central Ohio | 805 | 49 | 854 | 6.00% |
| 2010 | HBA of Greater Cincinnati | 640 | 58 | 698 | 9.00% |
| 2010 | ACCA of Ohio | 269 | 88 | 357 | 33.00% |
| 2010 | PHCC of Ohio | 280 | 18 | 298 | 6.00% |
| 2010 | HBA of Dayton | 402 | 66 | 468 | 16.00% |
| 2010 | BIA of Stark County | 300 | 43 | 343 | 15.00% |
| Year | Oklahoma Associations | Start Total | Drive Total | Grand Total | % of Growth |
| 2007 | Central Oklahoma HBA | 1172 | 233 | 1405 | 20.00% |
| 2007 | HBA of Greater Tulsa | 1075 | 190 | 1265 | 18.00% |
| 2007 | Lawton HBA | 112 | 44 | 156 | 39.00% |
| 2007 | Norman BA | 212 | 125 | 337 | 59.00% |
| Year | Oregon Associations | Start Total | Drive Total | Grand Total | % of Growth |
| 2007 | HBA Lane County | 440 | 58 | 498 | 13.00% |
| 2007 | HBA of Josephine County | 164 | 46 | 210 | 28.00% |
| 2007 | HBA of Marion & Polk Counties | 746 | 51 | 797 | 7.00% |
| 2007 | HBA of Metro Portland | 1434 | 65 | 1499 | 5.00% |
| 2007 | Klamath Basin HBA | 209 | 46 | 255 | 22.00% |
| 2007 | Lincoln County HBA | 40 | 3 | 43 | 8.00% |
| 2006 | Central Oregon HBA | 760 | 190 | 950 | 25.00% |
| 2006 | HBA Lane County | 471 | 100 | 571 | 21.00% |
| 2006 | HBA of Jackson County | 478 | 81 | 559 | 17.00% |
| 2006 | HBA of Josephine County | 221 | 79 | 300 | 36.00% |
| 2006 | HBA of Marion & Polk Counties | 841 | 130 | 971 | 15.00% |
| 2006 | HBA of Metro Portland | 1327 | 107 | 1434 | 8.00% |
| 2006 | HBA of Southwestern Oregon | 113 | 46 | 159 | 41.00% |
| 2006 | Klamath Basin HBA | 224 | 77 | 301 | 34.00% |
| 2006 | Lincoln County HBA | 21 | 15 | 36 | 71.00% |
| 2006 | Umpqua Valley HBA | 262 | 80 | 342 | 31.00% |
| 2006 | Willamette Valley | 303 | 22 | 325 | 7.00% |
| 2005 | Central Oregon HBA | 488 | 249 | 737 | 51.00% |
| 2005 | HBA Lane County | 443 | 75 | 518 | 17.00% |
| 2005 | HBA of Jackson County | 364 | 107 | 471 | 29.00% |
| 2005 | HBA of Josephine County | 135 | 76 | 211 | 56.00% |
| 2005 | HBA of Marion a& Polk Counties | 745 | 200 | 945 | 27.00% |
| 2005 | HBA of Metro Portland | 1127 | 123 | 1250 | 11.00% |
| 2005 | HBA of Southwestern Oregon | 82 | 29 | 111 | 36.00% |
| 2005 | Klamath Basin HBA | 152 | 87 | 239 | 57.00% |
| 2005 | Umpqua Valley HBA | 157 | 80 | 237 | 51.00% |
| 2005 | Willamette Valley | 215 | 95 | 310 | 44.00% |
| 2009 | Central Oregon BA | 820 | 85 | 905 | 10.00% |
| 2009 | HBA of Marion & Polk Counties | 669 | 76 | 745 | 11.00% |
| 2009 | HBA of Metro Portland | 1076 | 73 | 1149 | 7.00% |
| 2009 | HBA of Josephine County | 143 | 25 | 168 | 17.00% |
| 2009 | HBA of Lane County | 373 | 24 | 397 | 6.00% |
| 2009 | Klamath Basin HBA | 140 | 8 | 148 | 6.00% |
| 2011 | Bend Chamber of Commerce | 1231 | 56 | 1287 | 5.00% |
| Year | Pennsylvania Associations | Start Total | Drive Total | Grand Total | % of Growth |
| 2006 | BIA of Northeastern PA | 407 | 65 | 472 | 16.00% |
| 2006 | Blair County BA | 202 | 44 | 246 | 22.00% |
| 2006 | Carbon Builders Association | 134 | 20 | 154 | 15.00% |
| 2006 | HBA of Berks County | 676 | 82 | 758 | 12.00% |
| 2006 | HBA of Chester & Delaware County | 481 | 65 | 546 | 14.00% |
| 2006 | Lackawanna HBA | 201 | 42 | 243 | 21.00% |
| 2006 | Mercer County HBA | 123 | 12 | 135 | 10.00% |
| 2006 | Pike County BA | 161 | 85 | 246 | 53.00% |
| 2006 | West Branch-Susquehanna BA | 237 | 77 | 314 | 32.00% |
| 2005 | BA of Central PA | 326 | 41 | 367 | 13.00% |
| 2005 | BA of Metro Pittsburgh | 662 | 128 | 790 | 19.00% |
| 2005 | BIA of Lancaster | 579 | 150 | 729 | 26.00% |
| 2005 | Central Susquehanna BA | 133 | 42 | 175 | 32.00% |
| 2005 | Clinton County BA | 26 | 8 | 34 | 31.00% |
| 2005 | HBA of Bucks & Montgomery Co. | 564 | 139 | 703 | 25.00% |
| 2005 | Lawrence County BA | 113 | 66 | 179 | 58.00% |
| 2005 | Lebanon County BA | 360 | 27 | 387 | 7.00% |
| 2005 | Mifflin-Juniata BA | 19 | 12 | 31 | 63.00% |
| 2005 | Washington County BA | 223 | 52 | 275 | 23.00% |
| 2005 | Wayne County BA | 155 | 88 | 243 | 57.00% |
| 2005 | York County BA | 778 | 53 | 831 | 7.00% |
| Year | South Carolina Associations | Start Total | Drive Total | Grand Total | % of Growth |
| 2007 | Charleston Trident HBA | 604 | 44 | 648 | 7.00% |
| 2007 | HBA of Aiken County | 250 | 80 | 330 | 32.00% |
| 2007 | HBA of Greater Columbia | 1313 | 193 | 1506 | 15.00% |
| 2007 | HBA of Greater Pee Dee | 285 | 149 | 434 | 52.00% |
| 2007 | HBA of Greenville | 547 | 93 | 640 | 17.00% |
| 2007 | HBA of Lancaster County | 71 | 18 | 89 | 25.00% |
| 2007 | HBA of Spartanburg | 486 | 157 | 643 | 32.00% |
| 2007 | Hilton Head Area HBA | 446 | 145 | 591 | 33.00% |
| 2007 | Lakelands HBA | 100 | 46 | 146 | 46.00% |
| Year | Tennessee Associations | Start Total | Drive Total | Grand Total | % of Growth |
| 2007 | Clarksville-Montgomery Co. HBA | 181 | 7 | 188 | 4.00% |
| 2007 | HBA of Cumberland County | 56 | 31 | 87 | 55.00% |
| 2007 | HBA of Greater Kingsport | 184 | 60 | 244 | 33.00% |
| 2007 | HBA of Greater Knoxville | 773 | 20 | 793 | 3.00% |
| 2007 | HBA of Rutherford Cty | 387 | 16 | 403 | 4.00% |
| 2007 | HBA of Southern Tennessee | 709 | 61 | 770 | 9.00% |
| 2007 | Jackson Area HBA | 136 | 28 | 164 | 21.00% |
| 2007 | Johnson City Area HBA | 261 | 83 | 344 | 32.00% |
| 2007 | Ocoee Region BA | 153 | 25 | 178 | 16.00% |
| 2007 | South Central HBA | 138 | 30 | 168 | 22.00% |
| 2007 | Warren County HBA | 37 | 3 | 40 | 8.00% |
| 2006 | Clarksville-Montgomery Co. HBA | 156 | 77 | 223 | 49.00% |
| 2006 | HBA of Greater Kingsport | 139 | 96 | 235 | 69.00% |
| 2006 | HBA of Greater Knoxville | 678 | 231 | 909 | 34.00% |
| 2006 | HBA of Middle Tennessee | 987 | 135 | 1122 | 14.00% |
| 2006 | HBA of Rutherford County | 269 | 167 | 436 | 62.00% |
| 2006 | HBA of Southern Tennessee | 739 | 79 | 818 | 11.00% |
| 2006 | Jackson Area HBA | 155 | 32 | 187 | 21.00% |
| 2006 | Memphis Area HBA | 1021 | 533 | 1554 | 52.00% |
| 2006 | Ocoee Region BA | 143 | 25 | 168 | 17.00% |
| 2006 | South Central HBA | 82 | 26 | 108 | 32.00% |
| 2009 | South Central HBA | 109 | 12 | 121 | 11.00% |
| 2009 | Memphis Area HBA | 741 | 191 | 932 | 26.00% |
| 2009 | HBA of Greater Kingsport | 183 | 29 | 212 | 16.00% |
| 2009 | HBA of Greater Knoxville | 622 | 40 | 662 | 6.00% |
| 2009 | HBA of Middle Tennessee | 1033 | 30 | 1063 | 3.00% |
| 2009 | HBA of Rutherford County | 311 | 28 | 339 | 9.00% |
| 2009 | Ocoee Region BA | 102 | 10 | 112 | 10.00% |
| 2009 | HBA of Southern Tennessee | 534 | 78 | 612 | 15.00% |
| 2010 | Memphis Area HBA | 734 | 121 | 855 | 17.00% |
| 2010 | HBA of Greater Kingsport | 183 | 29 | 212 | 16.00% |
| 2010 | HBA of Upper Cumberland | 100 | 55 | 155 | 55.00% |
| 2010 | HBA of Greater Knoxville | 506 | 48 | 554 | 10.00% |
| 2010 | HBA of Southern Tennessee | 533 | 32 | 565 | 6.00% |
| Year | Texas Associations | Start Total | Drive Total | Grand Total | % of Growth |
| 2007 | Assoc.of Deep East Texas Builders | 82 | 114 | 196 | 139.00% |
| 2007 | BA of Greater Fort Worth | 802 | 44 | 846 | 5.00% |
| 2007 | BA of Greater San Antonio | 1012 | 272 | 1284 | 27.00% |
| 2007 | BA of Victoria | 173 | 78 | 251 | 45.00% |
| 2007 | BIA of the Highland Lakes | 268 | 100 | 368 | 37.00% |
| 2007 | Big Country HBA | 127 | 94 | 221 | 74.00% |
| 2007 | East Texas BA | 292 | 160 | 452 | 55.00% |
| 2007 | El Paso Association of Builders | 270 | 168 | 438 | 62.00% |
| 2007 | Galveston County BA | 48 | 25 | 73 | 52.00% |
| 2007 | Grayson, Fannin, Cooke Co. BA | 68 | 109 | 177 | 160.00% |
| 2007 | Greater Houston BA | 1802 | 212 | 2014 | 12.00% |
| 2007 | Greater New Braunfels HBA | 143 | 87 | 230 | 61.00% |
| 2007 | HBA of Bryan College Station | 330 | 91 | 421 | 28.00% |
| 2007 | HBA of Greater Austin | 791 | 55 | 846 | 7.00% |
| 2007 | HBA of Greater Dallas | 1919 | 193 | 2112 | 10.00% |
| 2007 | HBA of West Texas | 364 | 214 | 578 | 59.00% |
| 2007 | Heart of Texas BA | 266 | 71 | 337 | 27.00% |
| 2007 | Hill Country HBA | 223 | 84 | 307 | 38.00% |
| 2007 | Texas Panhandle BA | 302 | 82 | 384 | 27.00% |
| 2007 | Tyler Area BA | 697 | 150 | 847 | 22.00% |
| 2009 | El Paso BA | 281 | 76 | 357 | 27.00% |
| 2010 | HBA of Greater Austin | 833 | 46 | 879 | 6.00% |
| 2010 | Heart of Texas BA | 216 | 21 | 237 | 10.00% |
| 2010 | Texas Hill Country HBA | 226 | 40 | 266 | 18.00% |
| 2010 | BA of Corpus Christi | 182 | 24 | 206 | 13.00% |
| 2010 | Assoc.of Deep East Texas Builders | 76 | 49 | 125 | 64.00% |
| 2010 | BA of Victoria | 139 | 22 | 161 | 16.00% |
| 2010 | BA of Greater San Antonio | 783 | 87 | 870 | 11.00% |
| 2010 | Permian Basin HBA | 246 | 35 | 281 | 14.00% |
| 2010 | Greater Houston BA | 1646 | 55 | 1701 | 3.00% |
| 2010 | HBA of Greater Dallas | 1198 | 47 | 1245 | 4.00% |
| 2010 | Grayson, Fannin & Cooke Co. BA | 56 | 16 | 69 | 29.00% |
| 2010 | BA of Greater Fort Worth | 452 | 47 | 499 | 10.00% |
| 2010 | HBA of West Texas | 482 | 193 | 675 | 40.00% |
| 2010 | El Paso Association of Builders | 250 | 113 | 363 | 45.00% |
| 2010 | Memphis Area HBA | 570 | 54 | 624 | 10.00% |
| 2012 | El Paso Association of Builders | 200 | 98 | 298 | 49.00% |
| Year | Utah Associations | Start Total | Drive Total | Grand Total | % of Growth |
| 2007 | Northern Wasatch HBA | 378 | 103 | 481 | 27.00% |
| 2007 | Salt Lake HBA | 538 | 45 | 583 | 8.00% |
| 2007 | Utah Valley HBA | 652 | 160 | 812 | 25.00% |
| 2009 | HBA of Southern Utah | 416 | 66 | 482 | 16.00% |
| 2009 | Northern Wasatch HBA | 273 | 61 | 334 | 22.00% |
| 2009 | BIA of Iron County | 130 | 58 | 188 | 45.00% |
| 2009 | Utah Valley HBA | 430 | 40 | 470 | 9.00% |
| 2009 | Salt Lake HBA | 335 | 29 | 364 | 9.00% |
| 2009 | Park City Area HBA | 241 | 23 | 264 | 10.00% |
| 2009 | Bear Lake HBA | 25 | 20 | 45 | 80.00% |
| 2009 | Cache Valley HBA | 68 | 7 | 75 | 10.00% |
| Year | Vermont Associations | Start Total | Drive Total | Grand Total | % of Growth |
| 2006 | HB & RA of Northern Vermont | 506 | 133 | 639 | 26.00% |
| Year | Virginia Associations | Start Total | Drive Total | Grand Total | % of Growth |
| 2007 | Augusta HBA, Inc. | 135 | 88 | 223 | 65.00% |
| 2007 | B & A of Central Virginia | 180 | 58 | 238 | 32.00% |
| 2007 | Blue Ridge HBA | 258 | 36 | 294 | 14.00% |
| 2007 | Fredericksburg Area BA | 479 | 80 | 559 | 17.00% |
| 2007 | HBA of Richmond | 538 | 98 | 636 | 18.00% |
| 2007 | HBA of Southside VA | 327 | 49 | 376 | 15.00% |
| 2007 | Peninsula Housing & BA | 430 | 24 | 454 | 6.00% |
| 2007 | Piedmont Virginia BIA | 142 | 98 | 240 | 69.00% |
| 2007 | Roanoke Regional HBA | 424 | 62 | 486 | 15.00% |
| 2007 | The Top of Virginia BA | 152 | 71 | 223 | 47.00% |
| 2007 | Tidewater BA | 1061 | 236 | 1297 | 22.00% |
| 2010 | Tidewater BA | 672 | 44 | 716 | 6.50% |
| 2010 | Top of VA BA | 66 | 34 | 100 | 52.00% |
| 2010 | Augusta HBA, Inc. | 167 | 35 | 200 | 20.00% |
| 2010 | Roanoke Regional HBA | 370 | 23 | 393 | 6.00% |
| 2010 | Fredricksburgh Area BA | 279 | 2 | 281 | 0.00% |
| 2010 | HBA of Richmond | 440 | 61 | 501 | 14.00% |
| 2010 | HBA of Central VA | 127 | 4 | 130 | 3.00% |
| 2010 | HBA of Southside VA | 191 | 9 | 200 | 5.00% |
| 2010 | HBA of Rappahannock | 52 | 21 | 73 | 44.00% |
| 2010 | Peninsula HBA | 314 | 80 | 372 | 18.00% |
| 2010 | Northern VA BIA | 472 | 34 | 506 | 7.00% |
| Year | Washington Associations | Start Total | Drive Total | Grand Total | % of Growth |
| 2007 | BIA of Clark County | 984 | 42 | 1026 | 4.00% |
| 2007 | BIA of Whatcom County | 526 | 102 | 628 | 19.00% |
| 2007 | Central Washington HBA | 714 | 58 | 772 | 8.00% |
| 2007 | HBA of Tri-Cities | 733 | 38 | 771 | 5.00% |
| 2007 | Jefferson County BBA | 96 | 9 | 105 | 9.00% |
| 2007 | Lower Columbia CCA | 227 | 44 | 271 | 19.00% |
| 2007 | MBA of King & Snohomish Co. | 4297 | 144 | 4441 | 3.00% |
| 2007 | MBA of Pierce County | 997 | 78 | 1075 | 8.00% |
| 2007 | North Central HHBA | 545 | 46 | 591 | 8.00% |
| 2007 | North Peninsula HBA | 282 | 75 | 357 | 27.00% |
| 2007 | Olympia Master Builders | 927 | 89 | 1016 | 10.00% |
| 2007 | Skagit-Island Counties | 617 | 59 | 676 | 10.00% |
| 2007 | Spokane HBA | 1094 | 106 | 1200 | 10.00% |
| 2006 | Central Washington HBA | 616 | 110 | 727 | 18.00% |
| 2006 | HBA of Tri-Cities | 710 | 95 | 805 | 13.00% |
| 2006 | North Central HBA | 401 | 146 | 547 | 37.00% |
| 2006 | Spokane HBA | 886 | 65 | 951 | 7.00% |
| 2005 | North Central HBA | 316 | 109 | 425 | 34.00% |
| 2005 | Olympia Master Builders | 921 | 37 | 958 | 4.00% |
| 2005 | Spokane HBA | 908 | 100 | 1008 | 11.00% |
| 2012 | NUCA of Washington | 91 | 39 | 130 | 43.00% |
| Year | Wisconsin Associations | Start Total | Drive Total | Grand Total | % of Growth |
| 2007 | Brown County HHBA | 1065 | 167 | 1232 | 16.00% |
| 2007 | Metropolitan Builders Association | 1256 | 295 | 1551 | 23.00% |
| 2006 | Central Wisconsin HBA | 179 | 42 | 221 | 23.00% |
| 2006 | Chippewa Valley HBA | 418 | 30 | 448 | 7.00% |
| 2006 | La Crosse Area BA | 283 | 126 | 409 | 44.00% |
| 2006 | Lakeland Builders Association | 198 | 95 | 293 | 48.00% |
| 2006 | Madison Area Builders Association | 969 | 143 | 1112 | 15.00% |
| 2006 | Manitowoc County HBA | 162 | 122 | 284 | 75.00% |
| 2006 | Racine-Kenosha BA | 185 | 48 | 233 | 26.00% |
| 2006 | Sheboygan County HBA | 162 | 83 | 245 | 51.00% |
| 2006 | South Central Wisconsin BA | 271 | 194 | 465 | 72.00% |
| 2006 | Valley Home Builders Association | 831 | 155 | 986 | 19.00% |
| 2006 | Winnebago HBA | 227 | 100 | 327 | 44.00% |
Recent Blog Posts
-
Understanding and dealing with “Milestone Members”
12 Jul 2013
Every member in your Association reaches some sort of “milestone” over the course of their membership. When it comes to Read More
-
Why “New Member Orientations” scare your members and what you can do
12 Jul 2013
OK, so you finally signed up that new member you’ve been after for a couple of years. In addition, it Read More
-
“Everyday is a Member Day!”
8 Jun 2012
(re-post from the past – but worth a re-read!) Gene Simmons of the rock band KISS (and amazingly successful business Read More
-
Florida Chamber of Commerce More Than Doubles its Membership in Two Days – in the “new economy”
29 Jul 2011
Kate and I are almost settled in from our move to Punta Gorda, Florida from Washington State. Look for new Read More
-
Three Hidden “Success Killers” and How to Beat Them!
6 Jul 2011
Three Hidden “Success Killers” and How to Beat Them! (Taken from the Chamber Direct Email Tips – 5.27.11) Before you Read More
New Member Companies
2005 - 2015
37,997
New Member Companies
Recruited Using the

Process as of December 2015